
Billboard.js is an easy-to-use JavaScript chart library, based on D3 v4 +. Billboard JS is a simple, reusable, customizable, and flexible JavaScript chart library based on the popular D3.js library.
billboard.js is a versatile JavaScript chart library based on D3.js, designed to make data visualization straightforward and effective. Here are some of its key features:
- Ease of Use: Simple and intuitive API for quick chart generation.
- Compatibility: Works with D3 v4+.
- Modularity: Written as an ES Module with ES6+ syntax.
- Rich Options: Extensive configuration options to customize charts.
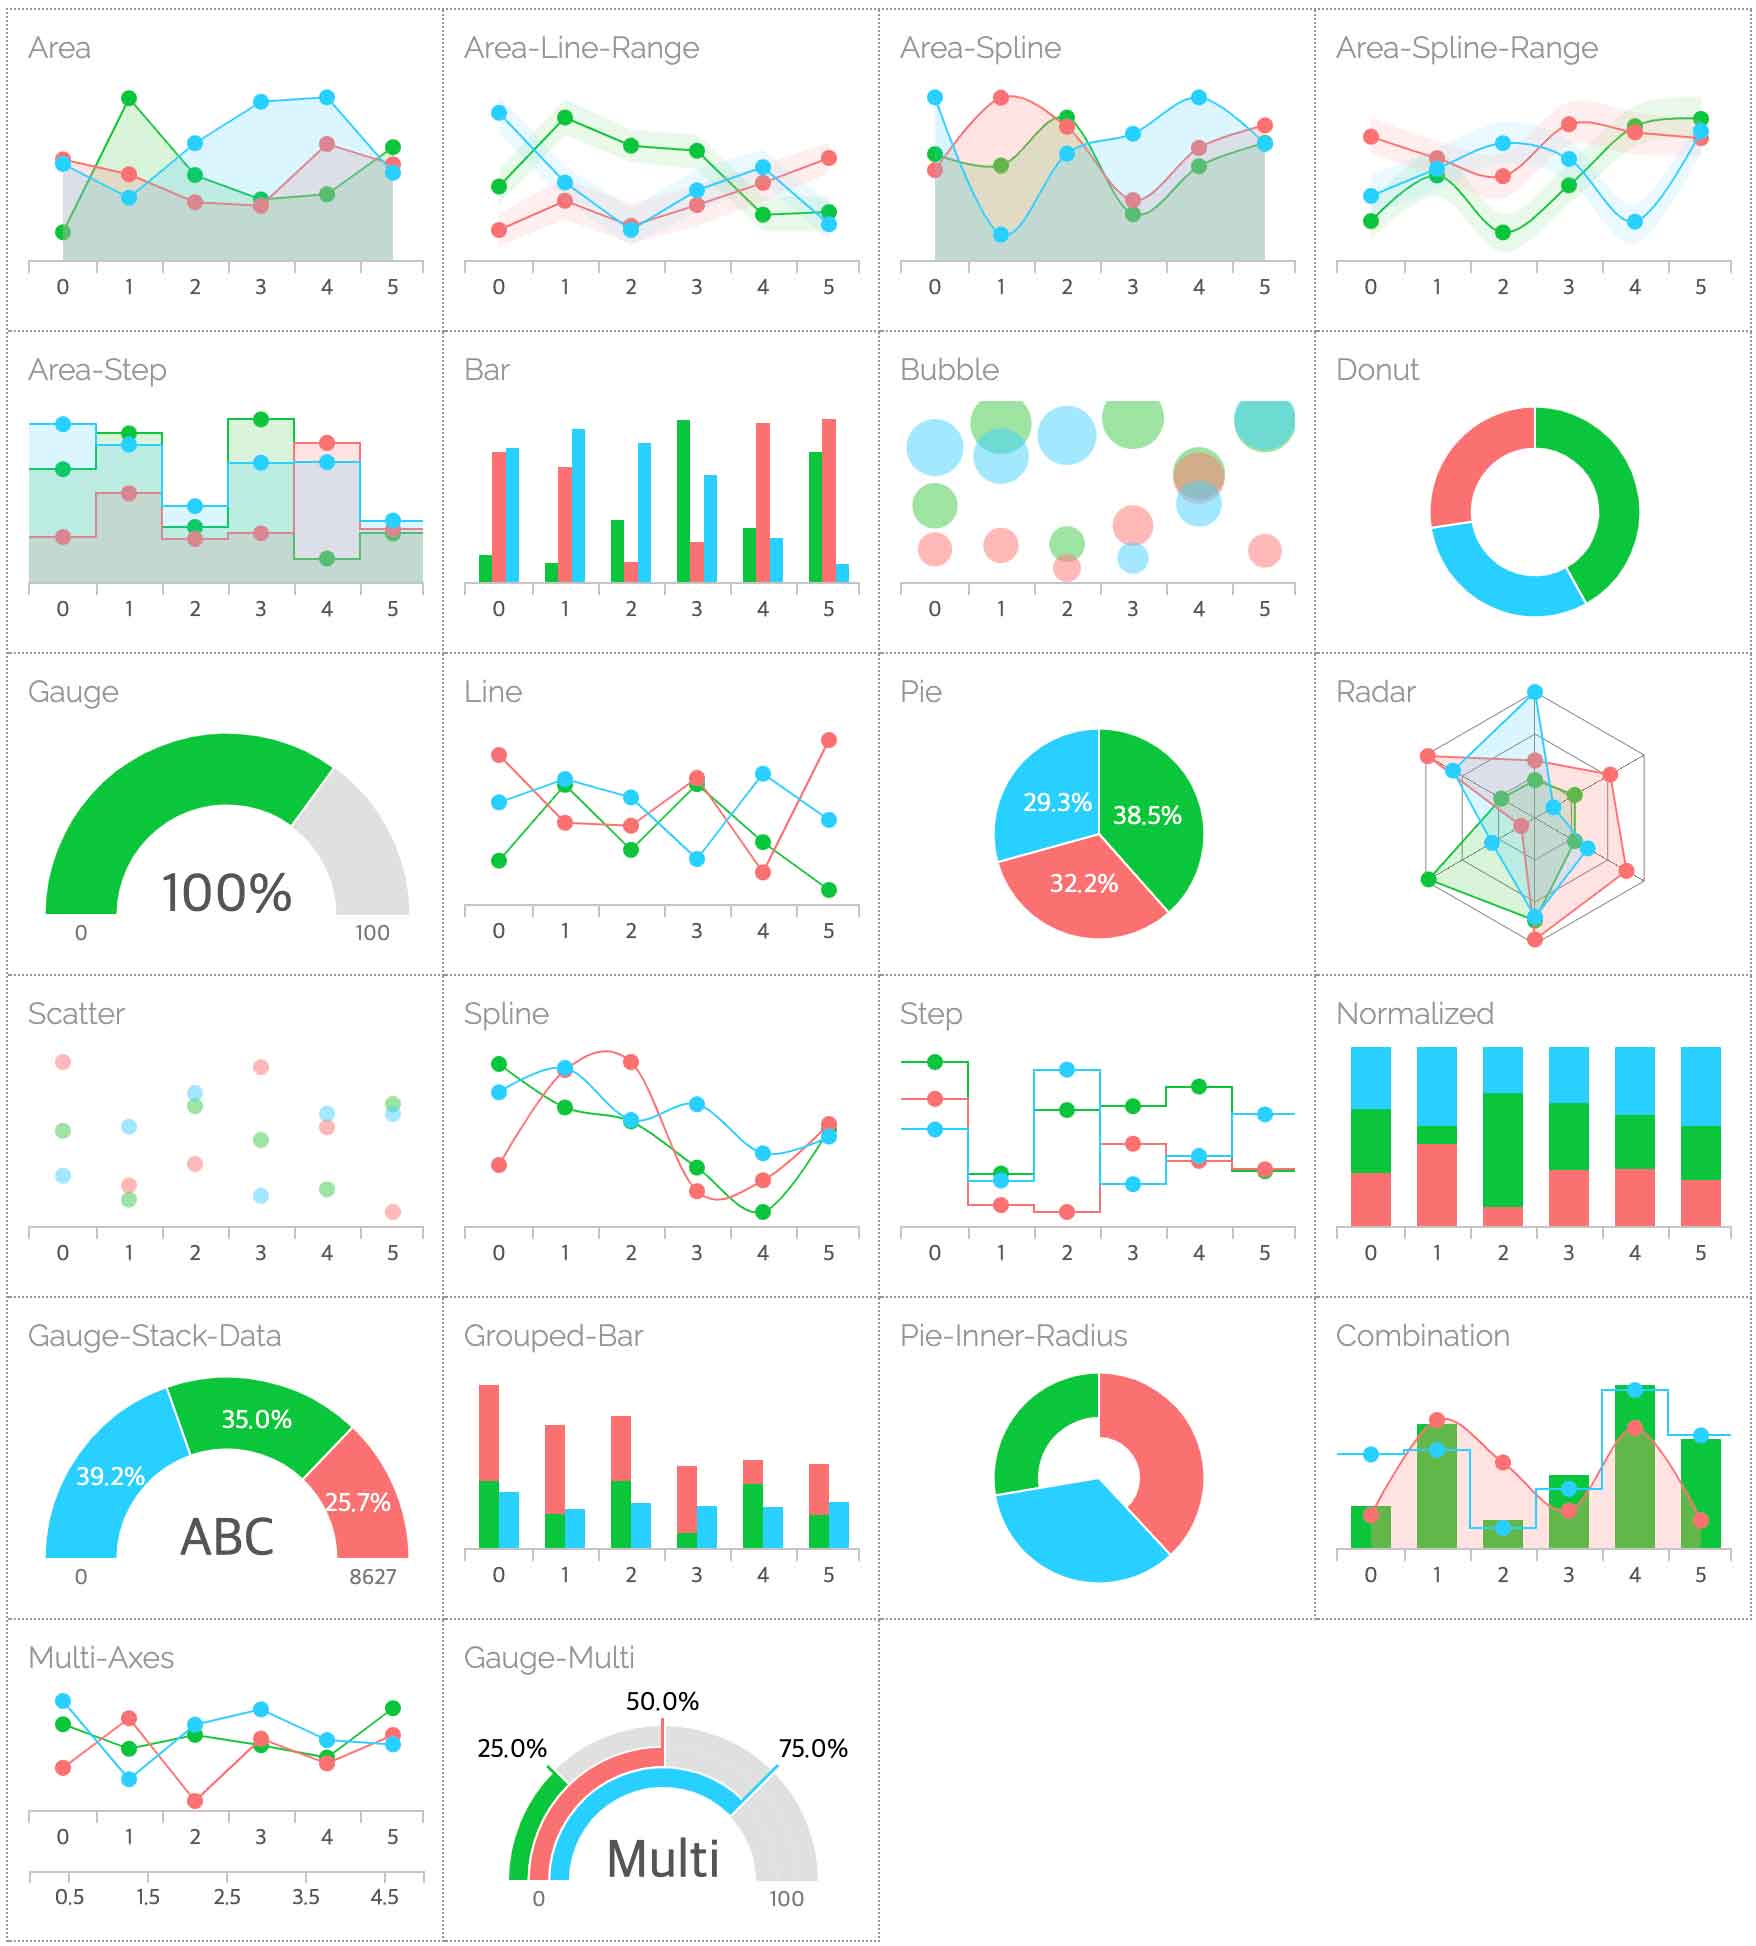
- Multiple Chart Types: Supports various chart types including bar, line, pie, donut, scatter, and more.
- Responsive Design: Automatically adjusts to different screen sizes.
- Theming: Offers different CSS themes for styling charts.
- Plugins: Supports additional plugins for extended functionality.
- Integration: Can be easily integrated with frameworks like React and Vue.
Chart Types:
- Line Chart
- Timeseries Chart
- Spline Chart
- Simple XYLine Chart
- Multiple XYLine Chart
- Line Chart With Regions
- Step Chart
- Area Chart
- StackedArea Chart
- Bar Chart
- StackedBar Chart
- ScatterPlot
- Pie Chart
- Donut Chart
- Gauge Chart
- Combination Chart
- More…
How to make use of it:
Install it by way of package managers:
# Yarn
yarn add billboard.js
# NPM
$ npm install billboard.js
Load the mandatory d3.js and the Billboard.js library’s JavaScript & CSS files within the HTML doc.
<script src="//d3js.org/d3.v4.min.js"></script>
<link rel="stylesheet" href="billboard.css">
<script src="billboard.js"></script>
Create a DIV component through which you need to generate the chart.
<div id="chart"></div>
Create a new instance and define your personal information to be plotted within the chart.
var myChart = bb.generate({
    bindto: "#chart",
    data: {
      // data here
    }
});
Simple Modular JavaScript Chart Library, billboard.js plugin/Github
See Demo And Download
Official Website(naver): Click Here
This superior jQuery/javascript plugin is developed by naver. For extra Advanced Usages, please go to the official website.


Be First to Comment